Tableau JS API 101
/Padawan Challenge: Build a website that interacts with Tableau.
Welcome! This is the first post in a series to come, which will attempt to explain how easy it really is to work with the Tableau JavaScript (JS) API. We all have different skill sets, and this dojo is a place for a beginning JS API Padawan (in this case Anya A’Hearn) will be taught by master (Chris DeMartini) and sensei Allan Walker. We attempted to write the lessons so that someone who has never played with the JS API can get started in an easy way step by step way with lots of pictures and code to copy incase you get stuck. All the code is also on our Padawan Dojo Git.
While we love rendering our dashboards in Tableau Server and Tableau Public, sometimes we might want to embed our Viz in a website, portal, or web application and be able to interact with it using other web objects.
In this post we start with the very, VERY, basics of setting up a simple webpage, embedding a Tableau viz in it, and then adding elements to your webpage that will interact with the Tableau viz. If you already are familiar with the JS API, check back in a few dojo lessons and we will move onto interacting with other web applications to do things like enable voice and gesture control, add sound or haptic feedback, or even apply it to an actual business use case :-p. If you don’t even really know what html is, this is the place for you to get started on the path to JS API awesome.
In this example we build company webpage with product information and want to be able to pass a user action from your website, like clicking on a product category, to update your Tableau viz.
Oh yeah, you need a viz. You could build your own, but as we always aim to please, you can just link to a viz that we already created and uploaded to Tableau Public. If you want to play with the workbook, here it is.
http://public.tableau.com/views/padawan/SuperStoreJSAPI101?:embed=y&:showTabs=y&:display_count=yes
You also need a webpage. What? I don’t have that??? You said baby steps and all of a sudden I need a webpage?
Relax! We are going to walk through how to create one on your local machine using just a text editor. In a future lesson we will walk through creating a website to play with, but for now, you just need to open up any text editor like notepad and type the below:
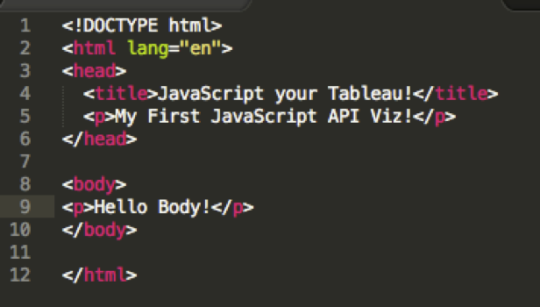
Nah - just messing with you. You can copy and paste the below instead. But if you actually re-type it, you can treat yourself to some ice cream.
<!DOCTYPE html>
<html lang=“en”>
<head>
<title>JavaScript you Tableau!</title>
<p>My First JavaScript API Viz!</p>
</head>
<body>
<p>Hello Body!</p>
</body>
</html>
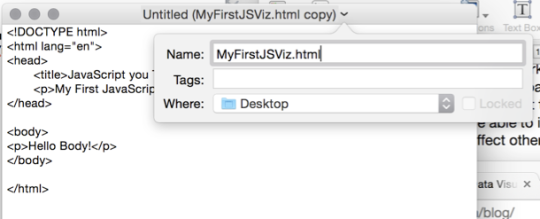
Then save the file with the extension .html We are calling ours MyFirstJSViz.html so that may be a good thing to go with.
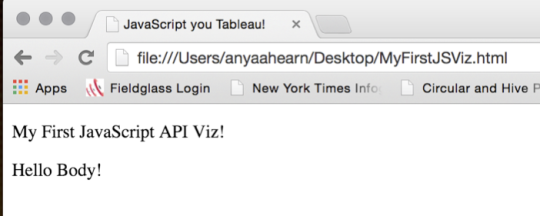
That’s it! You just built your first webpage. WOOT! Now just open your favorite web browser, from the File menu, select open, and then browse to the file (webpage) you just made. You should see the below:
Beginning working with the JS API
So now that we have our webpage skeleton, lets get working with the JS API. First step will be to get our viz to show up on our simple page above. Here are the steps followed to do this:
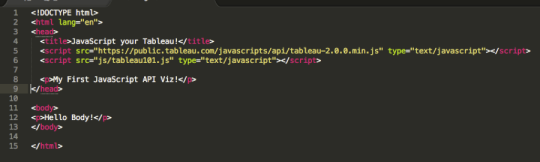
1) Add some references to your HTML file to let it know that we will be using the JS API and where to look for the JS fabulousness that we will be adding.
To add the JS and API references to your header, you need to add two lines as shown here:
<script src=“https://public.tableau.com/javascripts/api/tableau-2.0.0.min.js” type=“text/javascript”></script>
<script src=“js/tableau101.js” type=“text/javascript”></script>
The first points to Tableau’s API file, you will need this line on any page that you are trying to use the Tableau JS API. The second points to a file that has all of the JS functions in it that we are using for this webpage. Rather than put all of those in this html file, we will put them in another file and just pointing to it from the html file. We will get to that JS file and all its juicy goodness in step 3.
Go to your web browser and refresh the view. We now see that our webpage looks the same.
All that work for nothing? Be patient Padawan!
2) Add your Tableau viz to your webpage
Now that we have the JS API references added, its time to pop our Tableau viz into our webpage. The screen shot below has detailed comments to help understand the various steps needed to “call” the viz (that means embed it in your webpage so you can interact with it).
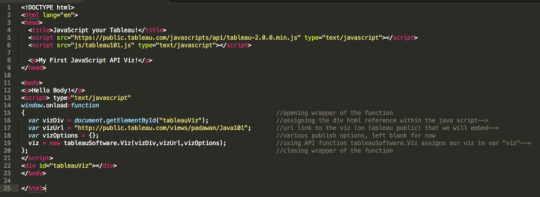
You can copy this code verbatim and only need to change the var vizURL variable value to assign your viz link if you decided not to use the one we provided on Tableau Public at: http://public.tableau.com/views/padawan/SuperStoreJSAPI101 . Make sure the get.ElementById values “tableauViz” are equal (case sensitive).
http://public.tableau.com/views/padawan/SuperStoreJSAPI101?:embed=n&:showTabs=n&:display_count=no
<script type=“text/javascript”>
window.onload= function()
{
var vizDiv = document.getElementById(“tableauViz”);
var vizUrl = “http://public.tableau.com/views/padawan/SuperStoreJSAPI101”;
var vizOptions = {};
viz = new tableauSoftware.Viz(vizDiv, vizUrl, vizOptions);
};
</script>
<div id=“tableauViz”></div>
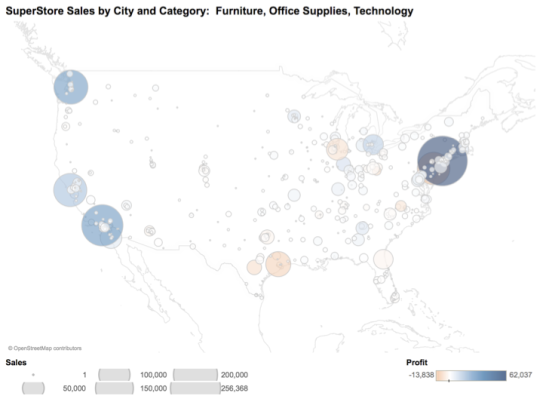
Now we see something like this…
3) Create your first .JS File
Now, let’s stay organized here (always important to keep this in mind when doing any type of coding). You don’t want a bunch of random code in your simple HTML file right? Way to messy and confusing! So as we mentioned in Step 2, we will put all of the JS API functions into another file and then just reference them from our HTML file as we need them.
This is the code to cut from your MyFirstJSViz.html file and paste into a new text file
<script type=“text/javascript”>
window.onload= function()
{
var vizDiv = document.getElementById(“tableauViz”);
var vizUrl = “http://public.tableau.com/views/padawan/SuperStoreJSAPI101”;
var vizOptions = {};
viz = new tableauSoftware.Viz(vizDiv, vizUrl, vizOptions);
};
</script>
Delete the two lines above that are in bold. Save this new text file in the same directory as your MyFirstJSViz.html file and name it tableau101.js.
Back to your MyFirstJSViz.html file should now look like this:
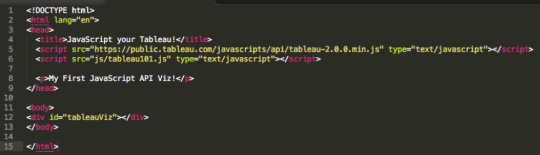
That’s right! You need three lines of code in your HTML file to get a viz to show (two JS references and the viz division, or div)…
Here is the HTML code again here incase you need to copy and paste:
<!DOCTYPE html>
<html lang=“en”>
<head>
<title>JavaScript you Tableau!</title>
<script src=“https://public.tableau.com/javascripts/api/tableau-2.0.0.min.js” type=“text/javascript”></script>
<script src=“tableau101.js” type=“text/javascript”></script>
<p>My First JavaScript API Viz!</p>
</head>
<body>
<p>Hello Body!</p>
<div id=“tableauViz”></div>
</body>
</html>
Now let’s look at your new JS file: tableau101.js. The code related to getting the visualization to show in the webpage is pretty much the same as it looked when it was in your HTML file, so we are really just pointing to the same code in another file.
To make the viz look cleaner, and more like part of a webpage, we have added two more lines of code in between the curly brackets of the vizOptions = {}. Descriptions of what these options do are to the right of the lines of code. These are optional:
hideTabs: true,
hideToolbar: True,
4) Filtering using the JS API
We have our webpage, we have our viz, now let’s do something JS’y with it! For now, let’s start with some simple, filtering and view changes. To do this we are going to add a JS function for each of the actions we want to take. Let’s start with filtering…
Here is a JS function that you can use to filter:
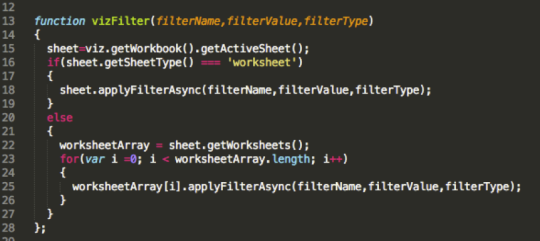
You can copy the new code here and paste it at end of your tableau101.js file after the last };
function vizFilter(filterName,filterValue,filterType)
{
sheet=viz.getWorkbook().getActiveSheet();
if(sheet.getSheetType() === ‘worksheet’)
{
sheet.applyFilterAsync(filterName,filterValue,filterType);
}
else
{
worksheetArray = sheet.getWorksheets();
for(var i =0; i < worksheetArray.length; i++)
{
worksheetArray[i].applyFilterAsync(filterName,filterValue,filterType);
}
}
};
The key piece of this code is the following line:
sheet.applyFilterAsync(filterName,filterValue,filterType) It will match up to our filter buttons in our HTML page.
- filterName = the Dimension Name you are filtering on
- filterValue = the value that you are passing in the filter (i.e. filter on the Product Category “furniture”)
- filterType = how you want the filter to act (i.e. Replace a filter value, Add a filter value, or Remove a filter value)
This code calls the Tableau JS API and for the active sheet applies the requested filter action. Once you get this piece working, it is really just a question of what parameters you send to action the filter. The above sample is a little more complicated as it will handle filtering of both a single sheet and a dashboard (if all sheets are to be filtered).
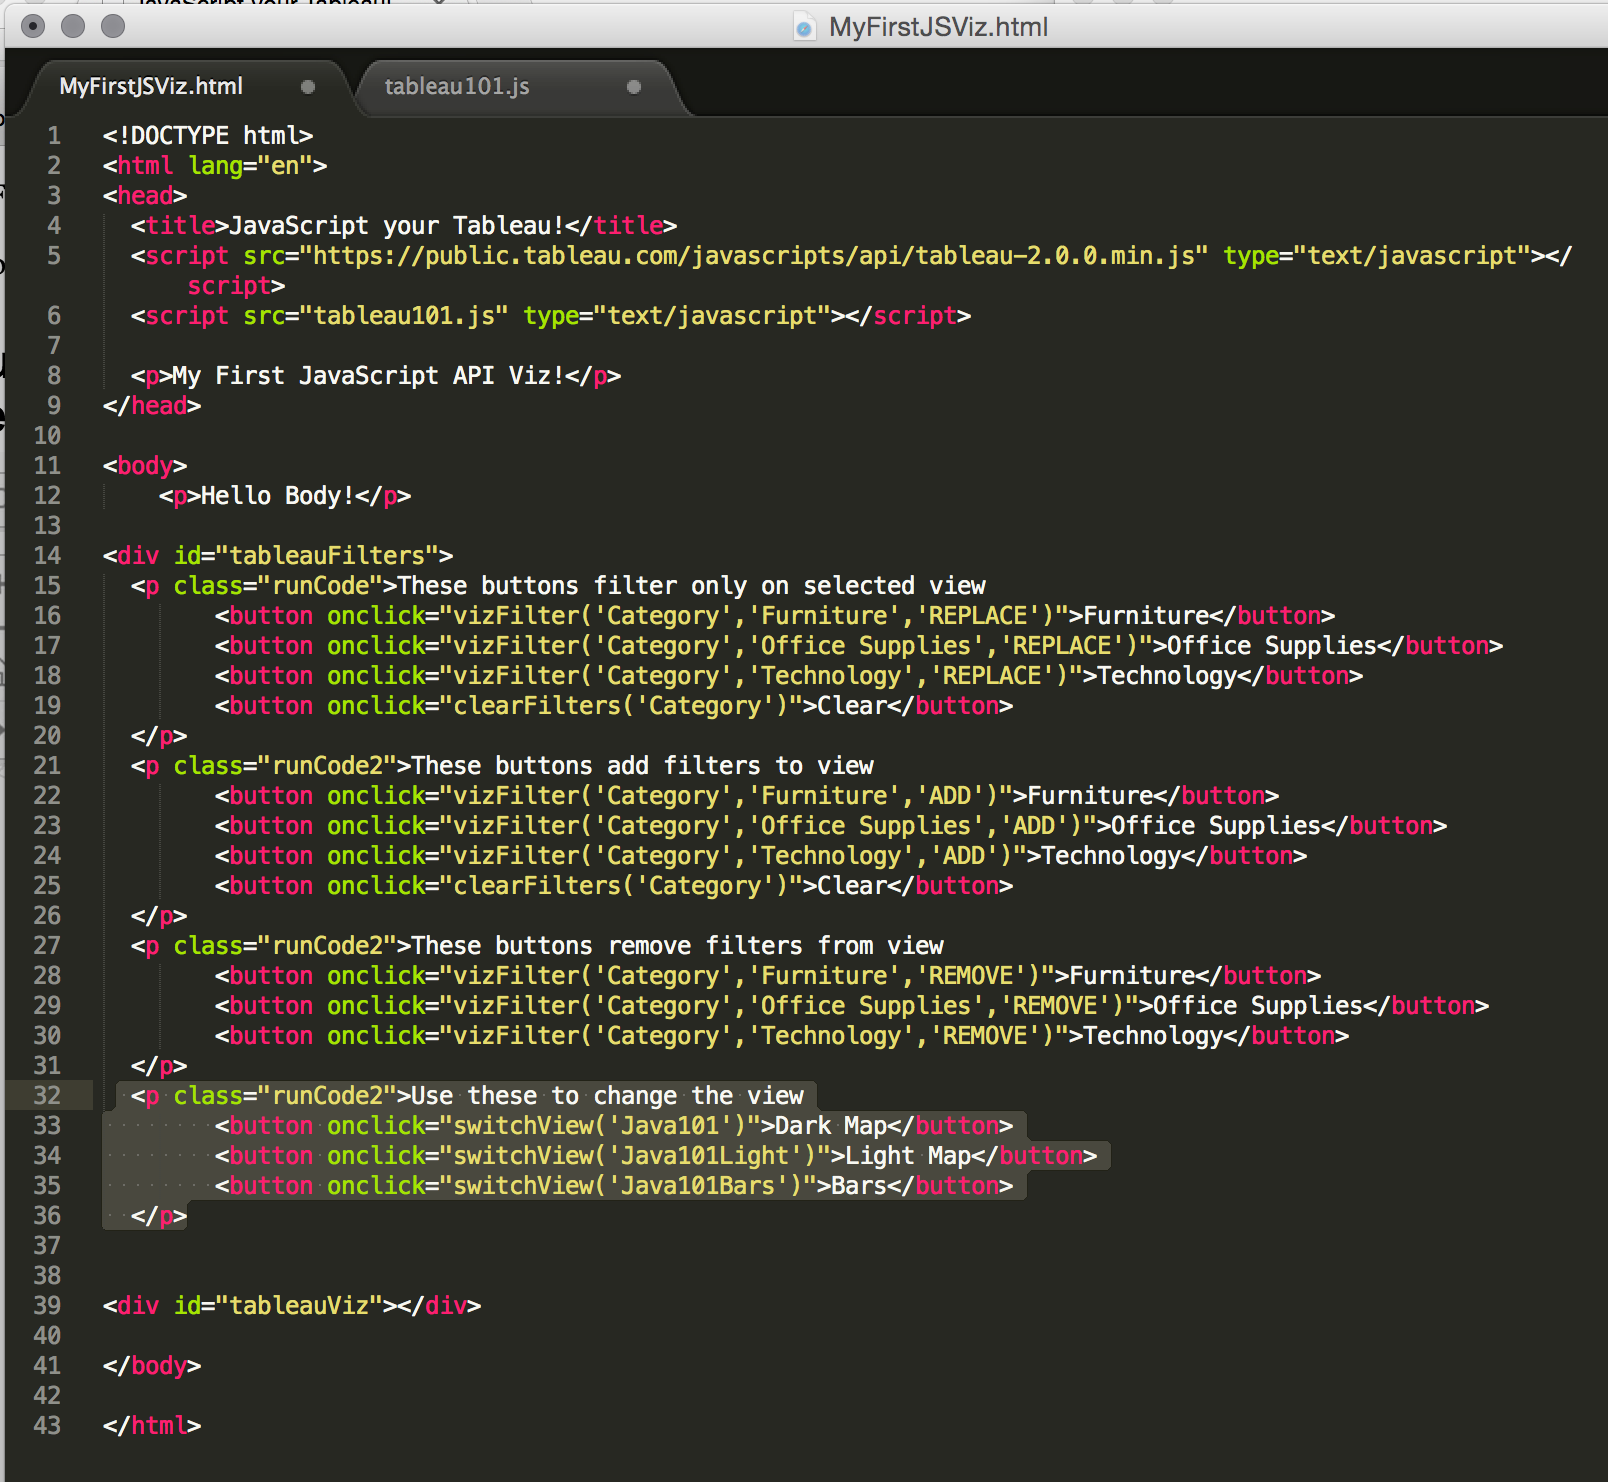
Now that we have the JS function set, we need to call it from our HTML file. There are a lot of different ways to do this. In this example we just put some simple buttons on the webpage for the user to click on to “action” the filters. Clicking on these buttons on your webpage will replace the filter on the Dimension “Category”. The yellow part is telling what to pass for the sheet.applyFilterAsync(filterName,filterValue,filterType). The white after that is just the label that appears on the button.
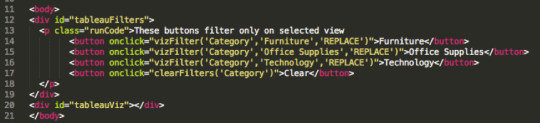
Here is the complete HTML file with the buttons added:
<!DOCTYPE html>
<html lang=“en”>
<head>
<title>JavaScript your Tableau!</title>
<script src=“https://public.tableau.com/javascripts/api/tableau-2.0.0.min.js” type=“text/javascript”></script>
<script src=“tableau101.js” type=“text/javascript”></script>
<p>My First JavaScript API Viz!</p>
</head>
<body>
<p>Hello Body!</p>
<div id=“tableauFilters”>
<p class=“runCode”>These buttons filter only on selected view
<button onclick=“vizFilter('Category’,'Furniture’,'REPLACE’)”>Furniture</button>
<button onclick=“vizFilter('Category’,'Office Supplies’,'REPLACE’)”>Office Supplies</button>
<button onclick=“vizFilter('Category’,'Technology’,'REPLACE’)”>Technology</button>
<button onclick=“clearFilters('Category’)”>Clear</button>
</p>
<p class=“runCode2”>These buttons add filters to view
<button onclick=“vizFilter('Category’,'Furniture’,'ADD’)”>Furniture</button>
<button onclick=“vizFilter('Category’,'Office Supplies’,'ADD’)”>Office Supplies</button>
<button onclick=“vizFilter('Category’,'Technology’,'ADD’)”>Technology</button>
<button onclick=“clearFilters('Category’)”>Clear</button>
</p>
<p class=“runCode2”>These buttons remove filters from view
<button onclick=“vizFilter('Category’,'Furniture’,'REMOVE’)”>Furniture</button>
<button onclick=“vizFilter('Category’,'Office Supplies’,'REMOVE’)”>Office Supplies</button>
<button onclick=“vizFilter('Category’,'Technology’,'REMOVE’)”>Technology</button>
</p>
<div id=“tableauViz”></div>
</body>
</html>
Notice in the button we are calling our “vizFilter” function within the onclick button action. You can also see that we are passing the appropriate variables for each button click respectively. We added three variations of this call for REPLACE, ADD and REMOVE filter types. Each is explained well here, but they are also very self-explanatory.
Here is the HTML code for all 3 which are just copy and pastes of the first set of buttons we added:
The only thing that has changed is the title saying what the buttons will do, and the last part of the onclick is changed from “REPLACE” to “ADD” or “REMOVE”
button onclick=“vizFilter('Category’,'Technology’,’REPLACE’)
button onclick="vizFilter('Category’,'Technology’,’ADD’)
button onclick="vizFilter('Category’,'Technology’,’REMOVE’)
5) Swapping out views using the JS API
This one is fairly simple. In the tableau101.js file, add the below code at the bottom of the file:
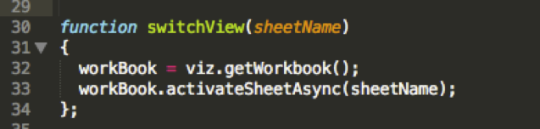
function switchView(sheetName)
{
workBook = viz.getWorkbook();
workBook.activateSheetAsync(sheetName);
};
And to call it from the html webpage, we once again add buttons to our MyFirstJSViz.html file and just sent the sheet names in our Tableau workbook based on the button clicked. See below…
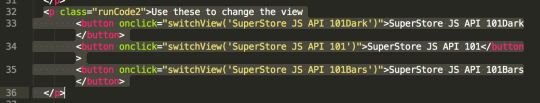
<p class="runCode2”>Use these to change the view
<button onclick=“switchView('SuperStore JS API 101Dark’)”>SuperStore JS API 101Dark</button>
<button onclick=“switchView('SuperStore JS API 101’)”>SuperStore JS API 101</button>
<button onclick=“switchView('SuperStore JS API 101Bars’)”>SuperStore JS API 101Bars</button>
</p>
Save both your MyFirstJSViz.html and tableau101.js files.
Open the MyFirstJSViz.html file with your webbrowser and click away!
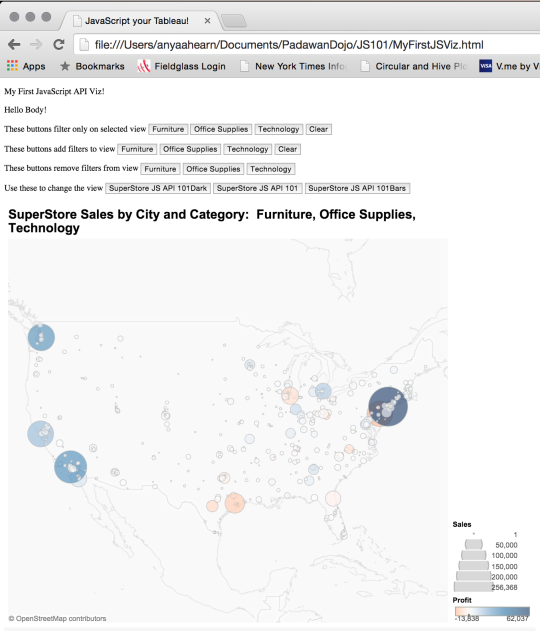
So there you have it! You made a webpage, embedded a viz in it, and made actions that your user clicked on in your site make your Tableau viz update using the JS API. It’s so time to celebrate!
What can we do with this…A LOT! You’ll have to come back soon to see the next exciting lesson at the Dojo coming soon, Swapping Dimensions and Measures using images.
If you want to read up on some of the best sites out there to learn more, get to gettin’ at the links below.
Sources for JS API Guidance:
http://russellchristopher.me/htdocs2/htdocs/index.html
http://onlinehelp.tableau.com/samples/en-us/js_api/tutorial.htm
http://www.tableau.com/learn/tutorials/on-demand/JS-api-intro-and-embed (requires login)
http://www.dataplusscience.com/TableauReferenceGuide/
http://www.bryanbrandow.com/2014/10/getting-started-with-the-tableau-JS-api.html
