Make Love Not War - with the Tableau 10.2 Spatial Connector
/"War Transposed" takes the coordinates of bombs dropped by the U.S. during the Vietnam War from 1965 to 1973 and moves them to the U.S.
This is not a statement on the right or wrong of the war, but rather an effort to create context and empathy for the destruction that happens during conflict.
This is an artistic piece. The data caveats are many. As such, there is no attempt to calculate the number of people affected, or buildings destroyed.
- Data source: https://insight.livestories.com/s/v2/vietnam/48973b96-8add-4898-9b33-af2a676b10bb/
- This data was then graciously cleaned up by Allan Walker and Sean Miller
- The bomb blast radii are calculated only from an average distance the supplied bomb weight.
- The cities chosen to be transposed from / to were based on personal choice, not a strategic similarity in why they would have been targeted.
- This is in no way an attempt to quantify or qualify the damage actually sustained in a statistically sound manner. It is an artistic piece only.
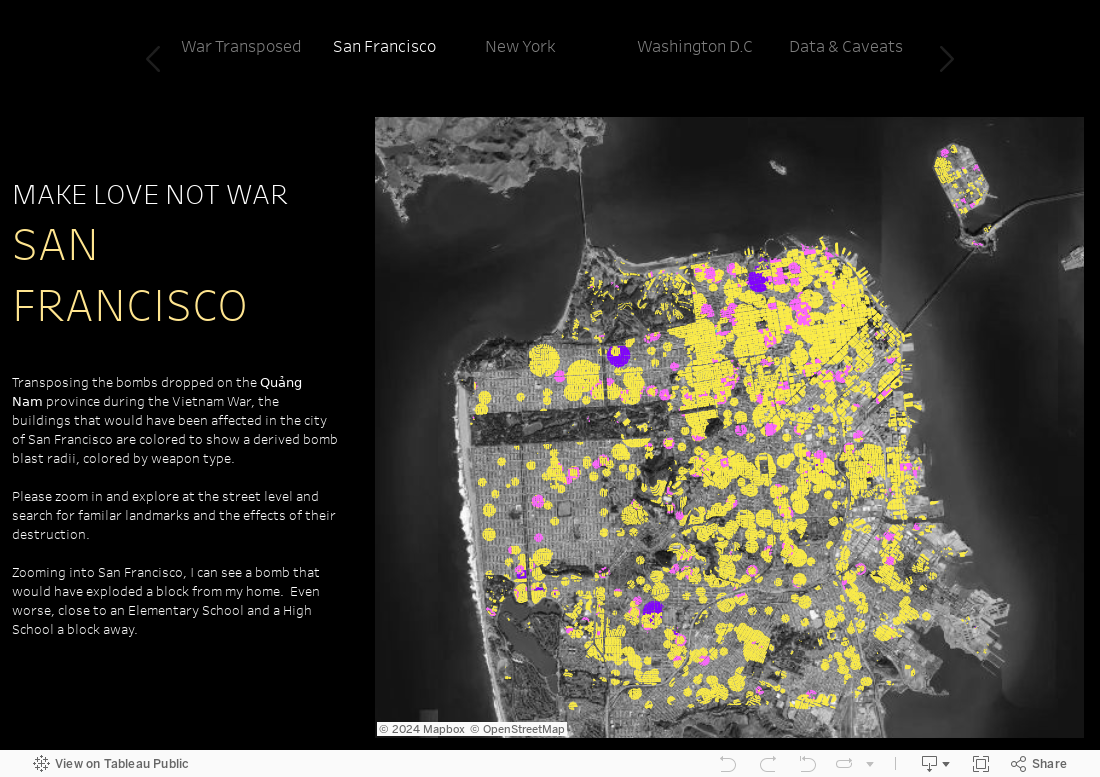
When I first go a hold of the data I the thing that struck my was the magnitude of the bombs dropped during the Vietnam War. Wanting more context, Allan Walker and I discussed how to create empathy, and in addition to all the 3D concepts I have been playing with in Mapbox, we came on the idea of transposing the damage to another city. I started with the West Coast, using the centroid of Ho Chi Minh City transposed onto that of San Francisco. Pretty much the whole West Coast is affected.


The shape did not quite match up to the contour of the coastline, but I realized it would match that of the East Coast quite well.
I then wanted to zoom into the personal. I wanted to transpose the damage from the bombing onto building level details in a few cities, so the viewer could dive into their city and see how they could have been affected if the bombs had been dropped near them. I zoomed in at one point on San Francisco and noticed the peace symbol painted on the playground of a local school near to where two bombs would have dropped.

To get the closeups of each of the cities, I calculated a bomb blast radius based on the weight of the bomb and transposed the latitudes and longitudes to the U.S. cities using Alteryx.

Once I had the transposed bomb blasts, I needed to match them to the buildings that would have been targeted using QGIS.

I actually wanted this viz to "make love, not war" and wanted to style the bomb blasts in colorful tones with the hopes that if you were exploring the viz and saw you were near a targeted building that perhaps you would feel gratitude over being safe, instead of fear. Instead of leaving black holes of destruction, leaving flower like colorful buildings, much as one would leave flowers in honor and remembrance of those passed. The style inspiration came from an exhibit I recently went to at the DeYoung,

Here is a zoomed in version of my neighborhood in San Francisco. There are two schools close to or near a blast.

Please dive into each of the cities and look for the familiar. Then have a think.