Sensor vs. Simulated IED: Max's Science Fair Project using Tableau for Image Analysis
/This is a post by Max, Anya's 12-year-old son. It was his Science / Engineering Fair project where he used Tableau to visualize his results. Thank you, Adam McCann and Merlijn Buit for your posts on color analysis that were used by Max for this project.

Max:
I am Max and I really like playing video games and going outside, that is kind of contradictory, but I like those things. The world is big and so is the universe, so making a difference as a tiny insignificant carbon-based molecule feels pretty good. When the Science Fair came around I freaked out. I had no idea of what to do. So one night I was talking to Allan Walker and my mom at dinner about the Manhattan Bombings, and I got this idea. The experiment was fun yet hard to do, especially because my mom made me do it three times. Here is my research as follows:
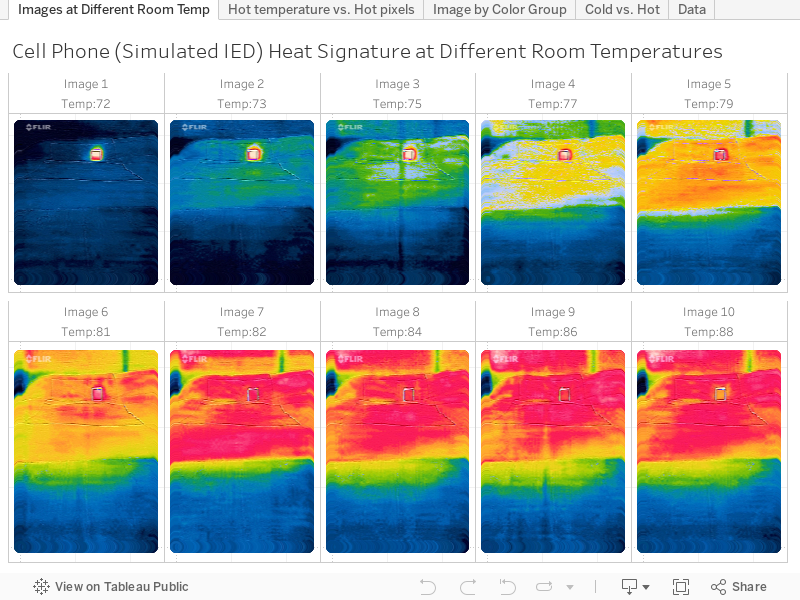
Each year many people die of bombs and other explosive devices. Some examples are the Boston Marathon and the recent bombing in Manhattan. In many modern wars, thousands of soldiers die due to IEDs (Improvised Explosive Devices). In my project, I will use an infrared sensor to find a cell phone (in place of an IED) in different temperature environments. Judging by how easy it is to see the cell phone, we can tell where infrared would work best, as well as where it would not work. Using this information we can know when to use infrared sensors to save lives.
Investigative question: What factors affect the ability of infrared sensors to detect Improvised Explosive Devices (IEDs)?
Hypothesis: If the weather is cold, then the sensors will work best.
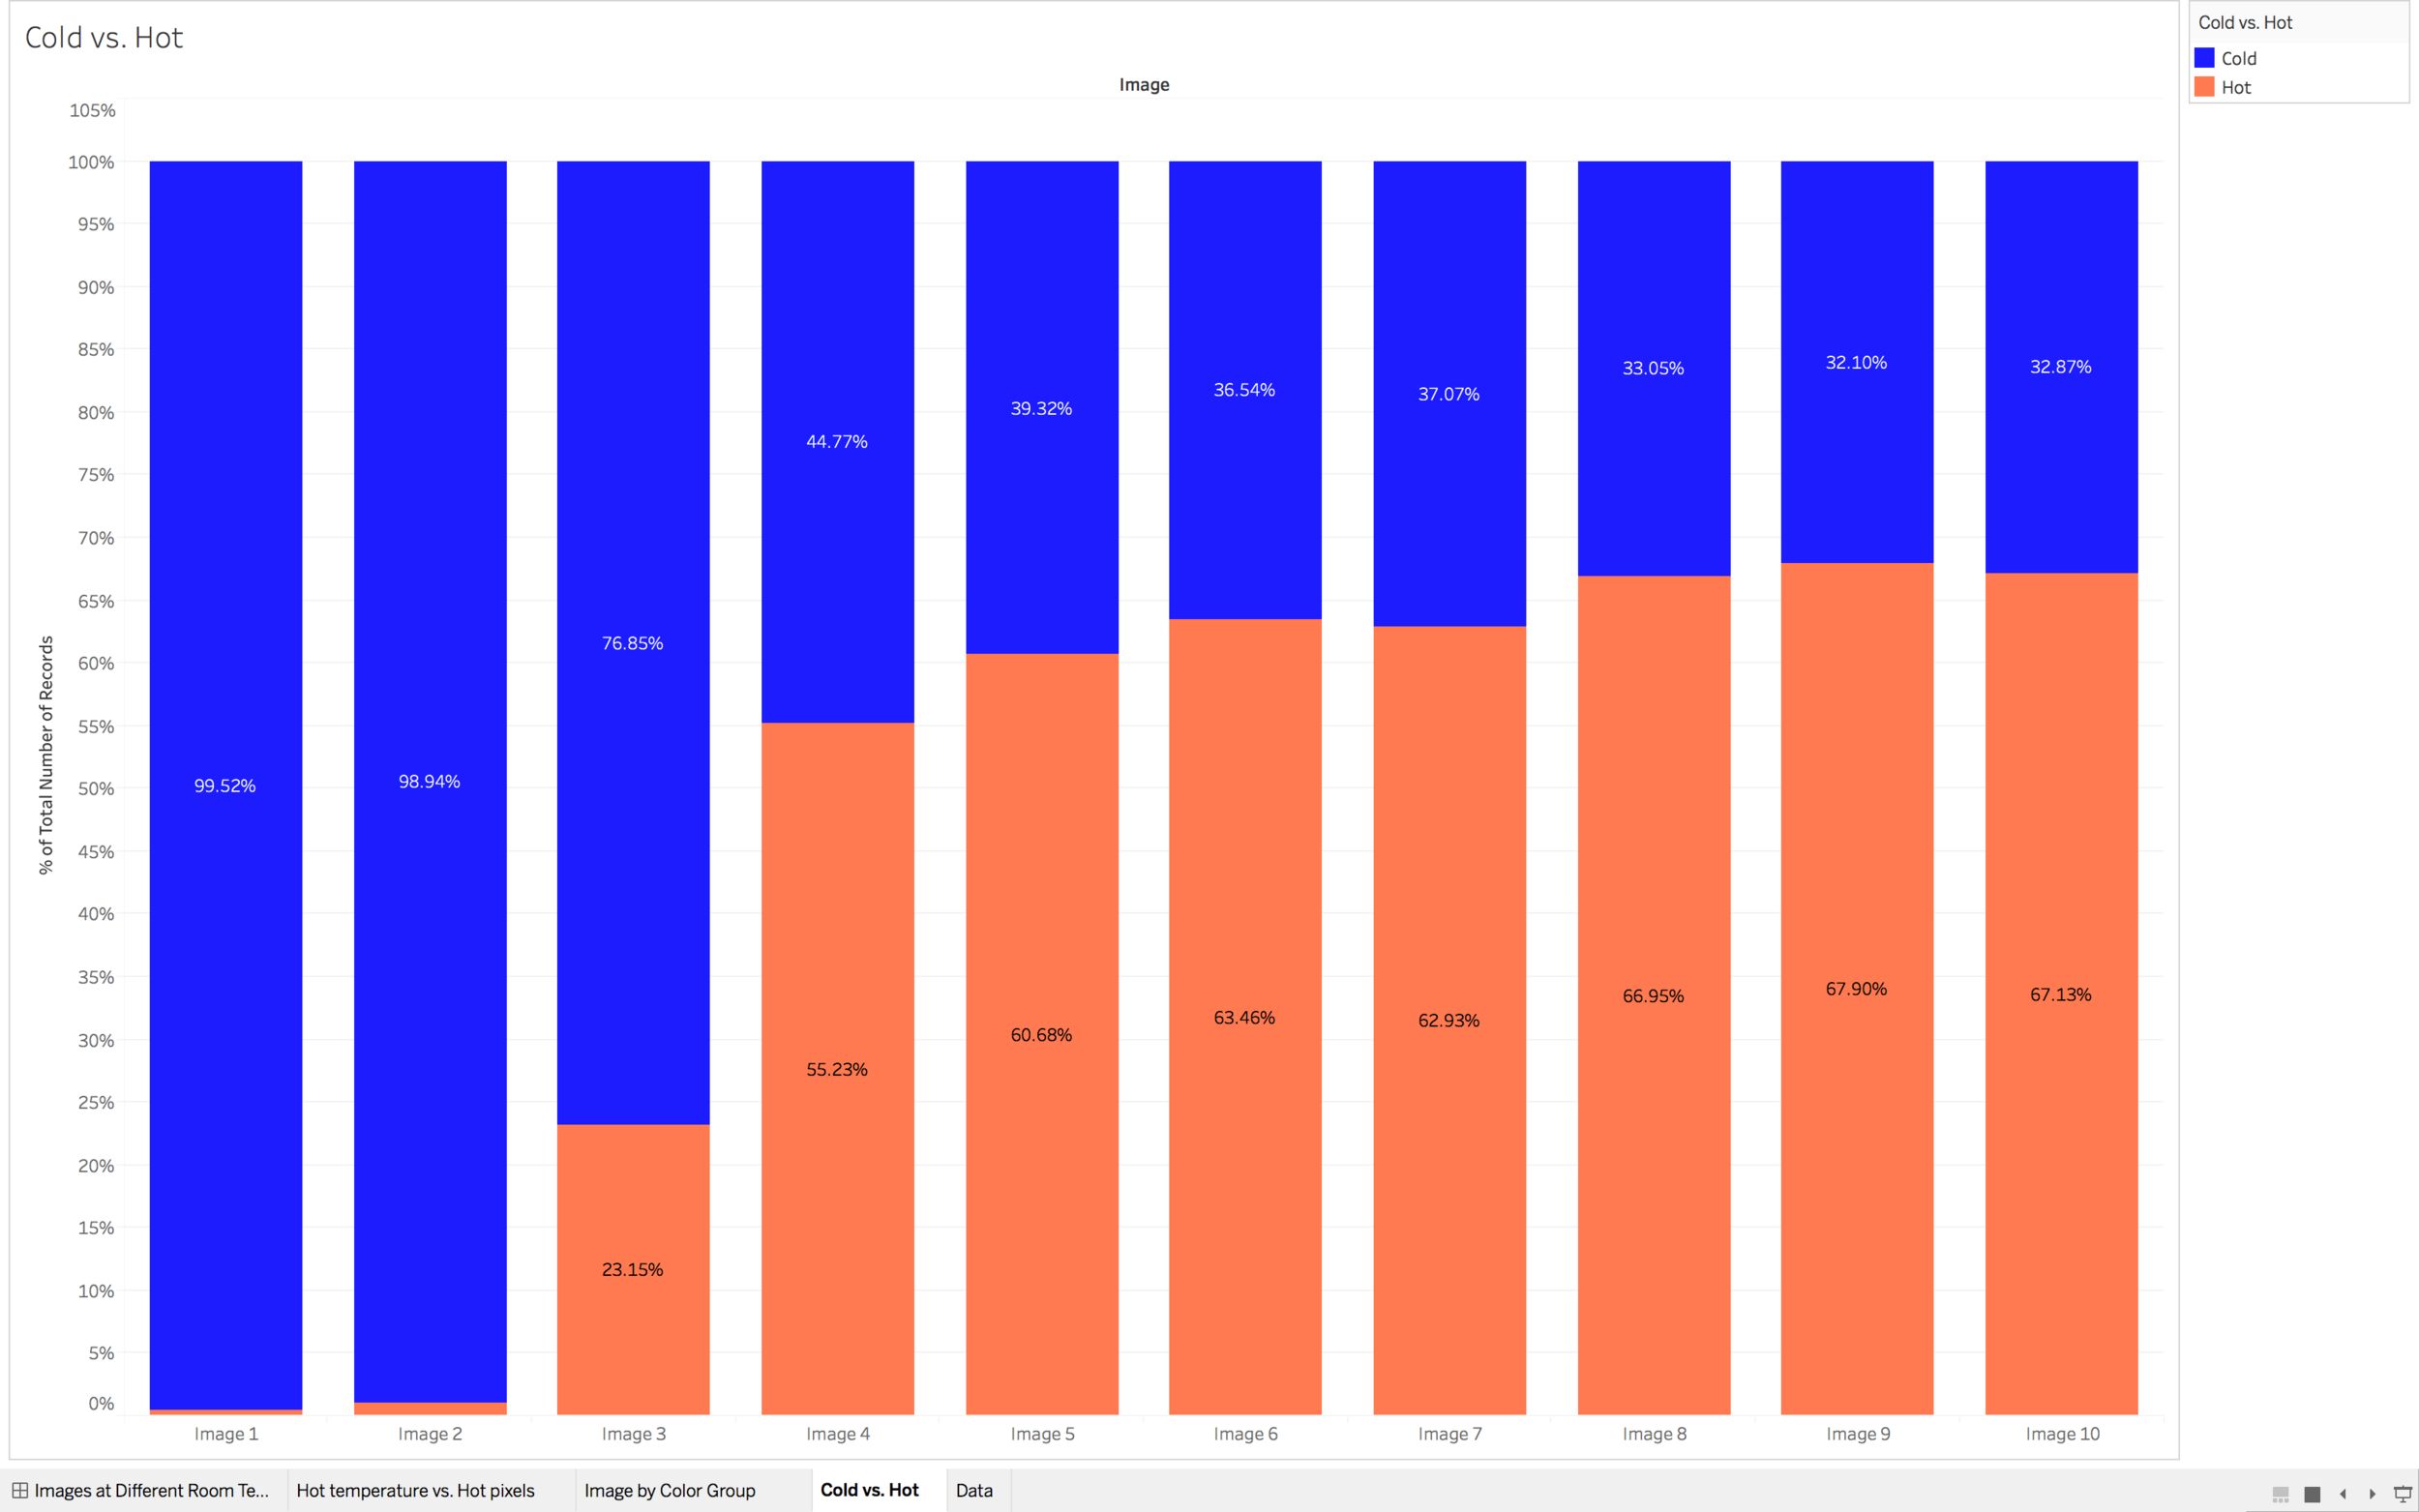
I exported the XY coordinates of the images and their RGB values using a software called ImageJ. I made graphs using ImageJ and Tableau. In the end, my hypothesis was correct, and when the percentage of hot pixels was 23% the “IED” was much harder to see then when the percentage was 67.13%. This shows us that the ability to see the IED is affected by the ambient temperature. This tells us that infrared sensors would work best in cold environments, which means that we have to find other ways to detect IEDs in hot environments. The Tableau workbook is below:
This chart shows the correlation of temperature with hot pixels.

Here is a chart of pixels in the images by color groups thanks to Adam's calculations to group RGB values by color family.

This chart shows "hot pixels" compared to "cold pixels".
Conclusions:
So in the end, my hypothesis was correct. The cellphone or “IED” was much easier to see in a colder environment. This is because of the masking of the heat signature by the room temperature. In the cold picture, there was no other signature close to that temperature, so the phone was easy to see. However, in the hot picture other signatures interfere and mask the signature of the phone. Knowing this information, we can tell when to use infrared sensors to detect IEDs and when to not.
Sources:
Globalsecurity.org
http://flir.com/flirone/ios/?pi_ad_id=%7Bcreative%7D&gclid=CIr3ibrUsM8CFYdufgodq10Dwg
http://duelingdata.blogspot.com/2016/08/starry-night-color-composition.html
https://www.infotopics.nl/infotopics-tableau-blog/entry/photoshop-in-tableau-guest-blog
List of materials:
Simulated IED (mobile phone)
Infrared Sensor (FLIR camera)
A display unit (Image color processing)
Power for sensor
A structure to hold the sensor stable
Heater (for ambient temperature)
Independent variable, Dependent variable:
Independent variable: Different Room temperatures
Dependent variable: The percent of pixels in the image that flag the IED based on a heat signature
Control variable: The sensor
Control group: At room temperature(72.8F, 21C)
Procedure:
Activate mobile phone
Take room temperature
Use sensor to take picture of IED
Increase temperature
Test at different temperatures
Record results
Calculate “hot pixels” vs "cold pixels".
