Weighted Medians for Weighted Data in Tableau
/There are two ways weighted medians get talked about in Tableau: The first type of weighted median is the one we covered in our earlier Padawan Dojo: Weighted Averages and Weighted Medians post where we’re aggregating a data set and we want to make sure the median is computed over the underlying records. The second type of weighted median is when the data itself has a weight, for example in survey data where each respondent has an assigned weight and we want to find the weighted median value of responses. In data terms there are two columns, value and weight, and we want to get the weighted median value. This post is about this second type of weighted median, and we’ll go through six different methods of computing it: one visual method and five other algorithms including the algorithms used by R, plus one more for working with Likert scales in survey data.
Note that the weighted median is entirely different (though often close in value to) the weighted average. For an example of weighted averages please see Steve Wexler’s excellent post Working with Weighted Survey Data – Data Revelations.
Overview of Weighted Medians
It’s helpful to articulate calculations in plain language, I’m going to start out with a regular median, then move on to the weighted median. Computing a regular median is at the simplest just two steps:
- Sort the values.
- Find the middle value.
For example given a set of numbers 1,2,2,3,4 the median is 2 (the middle number). There’s a complication when there’s an even number of values, one common rule in this case is to take the average of the two values. For example given 3,4,6,10 then the median would be 5 (the average of 4 and 6).
For a weighted median we change how the middle is found; instead of finding the middle value we are looking for the middle weight and then the median is the associated value for that weight. Here’s a very high-level algorithm:
- Sort the values.
- Add up the weights for the values in order (i.e. a running sum of weight).
- Find the value associated with the weight whose running sum crosses 50% of the total weight.
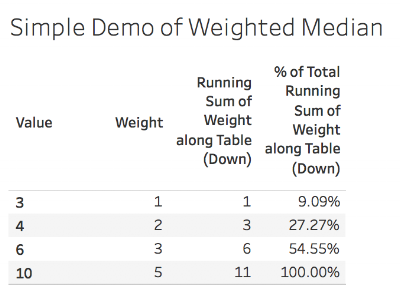
So for a set of numbers 3,4,6,10 with weights 1,2,3,5 then the median would be 6, since (1+2+3)/(1+2+3+5) = 6/11 = 54.55%. Here’s a view demonstrating this in Tableau:
Visually Computing the Weighted Median
If we don’t need to use the weighted median in calculations we can visually compute a weighted median in a few clicks using a bar chart and a quick table calculation. Note that this presumes that the data is ready to go, see the notes on Null and negative values in the next section on computing a weighted median as a calculation.
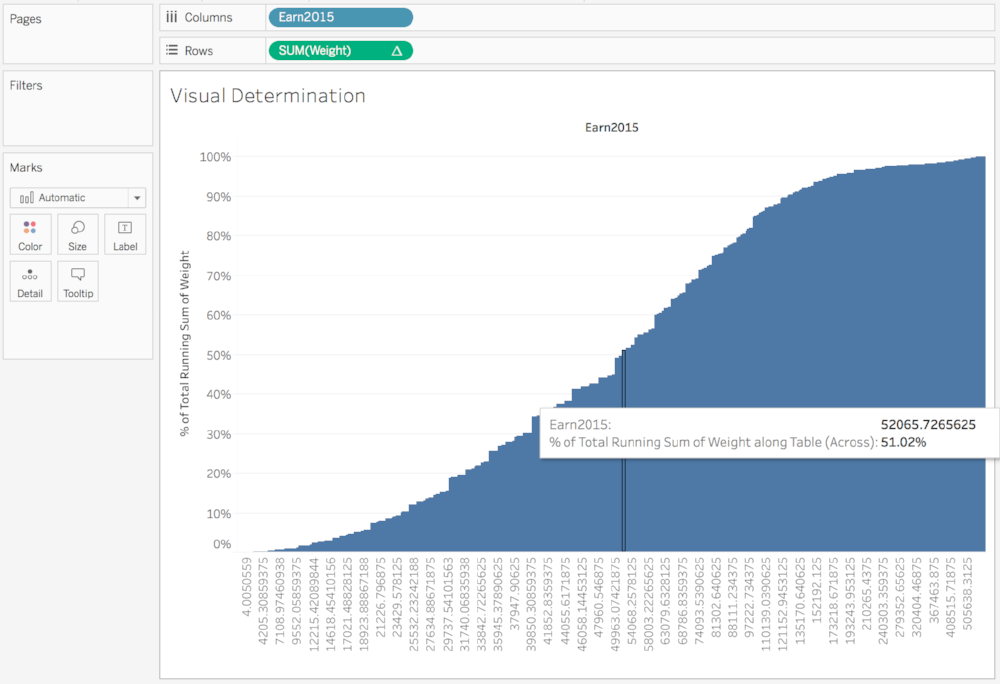
Here’s an example using a sample from the American Community Survey where the value is the Earn2015 field representing individual earnings and the weight is the weight field:
How to Visually Compute a Weighted Median
1. Drag in the value field (Earn2015 in this case) as a discrete dimension on Columns. Tableau’s default alphanumeric sort works perfectly here to sort the weights.
2. If the number of values is too large to fit the width of the view then use the Fit toolbar to Fit Width.
3. Drag SUM(Weight) to Columns. Tableau draws a bar chart:

4. Right-click on the SUM(Weight) pill and choose Quick Table Calculation->Running total. Tableau changes the bars to a running total with a compute using Table (Across), which works in this case.
5. Right-click on the SUM(Weight) table calculation pill and choose Edit Table Calculation… The table calculation window appears.
6. Click on Add Secondary Calculation. The window expands.
7. Under Secondary Calculation Type choose Percent of Total. The default compute using of Table (Across) also works in this case. Here's what the table calculation window should look like:

8. Close the table calculation window.
9. If there is no grid line for the 50% mark, then you can either edit the axis to set the tick marks to 10% increments or use the Analytics Pane to drag out a Constant line with a value of .5. The goal is to end up with some visual indicator of where the half-way point is on the % of Total axis.
10. Hover over the marks around the 50% line. Where the first bar is at or just over the 50% grid reference line is the value of the weighted median, 52065.7265625 in this case.

This is a great way to quickly get a weighted median. In this case it’s the equivalent of the R MatrixStats.weightedMedian() function with the ‘ties=max’ option. If you get the value for the mark just under the 50% grid or reference line then that’s the equivalent of the R weightedMedian() function with the ‘ties=min’ option.
Computing the Weighted Median as a Calculation
If we want to display the value of the weighted median, use the value to color marks, use it as a reference line, etc. then we’ll need to build out a calculated field. The process is a bit more complicated than the visual method, here’s an overview of the algorithm:
- Filter out all null values & weights, along with weights that are negative or 0. If you need the null, negative, or zero weights to be included then you’ll need to impute them with a positive value. Here’s a calculation that returns a boolean true/false, when put on the Filters Shelf and filtering for True removes all the unecessary values & weights: NOT ISNULL([Value]) AND NOT ISNULL([Weight]) AND [Weight] > 0.
- If there’s only one value left then that’s the median.
- Compute the total weight across all values.
- Sort the values in ascending order.
- For each unique value compute the running sum of the weight.
- Once the running sum crosses 1/2 of the total weight then identify the corresponding value. This requires some extra computation because of the particular method used for ties.
Interpolating Ties
There are a couple of cases where there is one single value for a weighted median:
* when there is only one value
* when the sum of weight for a given value is >50% of the total weight
For everything else the “midpoint” that is 50% of the total weight is between two values, so there’s a “tie” between the values just above and just below the midpoint. There are five different methods for resolving this that I’ve identified:
- A weighted linear interpolation. This is the default method R’s MatrixStats library uses for it’s weightedMedian() function and uses a scaled running sum instead of the default running sum to support the interpolation.
- Return the mean of the values where the running sum of weights are just above and just below midpoint. This is the equivalent of what Tableau’s standard MEDIAN() function does, for example, and the R weightedMedian() ‘ties=mean’ option.
- Return the lower (min) value.
- Return the upper (max) value, this is what we did in the visual example above.
- An alternative weighted linear interpolation for Likert scales (answer values such as 1,2,3,4,5) that explicitly assumes that each value is equidistant from its neighbors and treats the values as continuous. So a value of 4 would be treated as actually lying in the range from 3.5 to 4.4999… This method was described by Stuart Ramsbottom on the Tableau forums.
I built out two separate sets of calculations, one set uses a Choose Interpolation parameter to choose one of the first four methods and a separate Likert Weighted Median calculation for the Likert method. For the methods based on the R weightedMedian() function I translated the algorithms from the C code and added some optimizations based on how Tableau works, then to validate I used a view with Tableau's R integration to compare the weightedMedian() function to the native Tableau calculation. For the Likert method I adapted the original algorithm from the post linked to above and validated it on similar data sets along with various edge cases.
Building the Weighted Median Calculations and Some Views
In Tableau at least as of version 10.4 in order to do a running sum over an arbitrary set of values we must use a table calculation, and to use table calculations effectively we need to have some understanding of the viz level of detail (vizLOD). The vizLOD is defined by the dimensions in the view (Rows, Columns, Pages, and the Marks card). For these calculations to work the value we want to compute the weighted median for must be a dimension in the view and the Compute Using of the weighted median calculation must include that dimension.
In addition there’s a choice that we need to make based on the kind of view that we want. Do we want a single non-Null weighted median or do we want to pad the weighted median out to every mark? For example, if I wanted to use a weighted median as a label or in a nested calculation to color the marks above or below the median then I’d want to pad out the result to every mark. Therefore for each of the weighed median calculations there are two versions, one that returns a single value and one that returns a padded value. Examples of use cases for each are further down after the calculations.
Here’s a view showing the results of the calculations, the only dimension is the Value dimension and on the right we can see the four different median calculations:

The Formulas
Here are the formulas involved:
RS Weight - RUNNING_SUM(SUM([Weight]))
Total Weight - WINDOW_SUM(SUM([Weight]))
% of Total Weight - [RS Weight]/[Total Weight]
RS % of Total Weight Adj - RUNNING_SUM([% of Total Weight]) - [% of Total Weight]/2
The Weighted Median formula is fairly complicated because it’s dealing with the special cases of one value, two values, and the four different methods for handling ties. This formula returns only a single non-Null result that is the weighted median.
//Weighted Median
IF SIZE()=1 THEN
    MIN([Value])
ELSE
    //do the non-interpolated versions first
    IF [Choose interpolation] != 1 THEN
        //if the sum of weight is 1/2 and there are not 2 values then
        //we've found the median
        IF SUM([Weight]) = [Total Weight]/2 AND SIZE() != 2 THEN
            MIN([Value])
        //sum of weight is > 1/2 so we've found the median
        ELSEIF SUM([Weight]) > [Total Weight]/2 THEN
            MIN([Value])
        //everything else, we start out with a filter here to find
        //the "half" point that is at or just above Total Weight/2
        //at the half point
        ELSEIF (SIZE() != 2 AND [RS Weight] >= [Total Weight]/2 AND LOOKUP([RS Weight], -1) <= [Total Weight]/2)
        //there are only two marks and we're at the last mark
          OR (SIZE() = 2 AND LAST()=0 AND SUM([Weight]) >= [Total Weight]/2) THEN
            CASE [Choose interpolation]
                //2. mean. 1/2 way between two values
                WHEN 2 THEN LOOKUP(MIN([Value]),-1) + (MIN([Value])-LOOKUP(MIN([Value]),-1)) / 2
                //3. min - value just below the weight
                WHEN 3 THEN LOOKUP(MIN([Value]),-1)
                //4. max
                WHEN 4 THEN MIN([Value]) //MIN([Value])
            END
        //2 marks and the half point is the first mark
        ELSEIF (SIZE() = 2 AND FIRST() = 0 AND SUM([Weight]) > [Total Weight]/2) THEN
            //now for the non-interpolated versions
            CASE [Choose interpolation]
                //2. mean. 1/2 way between two values
                WHEN 2 THEN MIN([Value]) + (LOOKUP(MIN([Value]),1)-MIN([Value])) / 2
                //3. min - value just below the weight
                WHEN 3 THEN MIN([Value])
                //4.  max
                WHEN 4 THEN LOOKUP(MIN([Value]),1)
            END
        //ignore all other marks so we just return one value for the weighted median
        ELSE
            Null
        END //section that filters out weights and uses interpolation parameter
    //Choose interpolation 1. weighted interpolation
    //uses the R method to do the weighting, algorithm from https://github.com/HenrikBengtsson/matrixStats
    ELSE
        //filter so we only return one non-Null value
        IF (SIZE() != 2 AND [RS % of Total Weight Adj] > .5 AND LOOKUP([RS % of Total Weight Adj],-1) <= .5)
          OR (SIZE() = 2 AND ((FIRST() = 0 AND [RS % of Total Weight Adj] > .5)
                                OR (LAST() = 0 AND [RS % of Total Weight Adj] >= .5))) THEN
            MIN([Value])
            + (0.5 - [RS % of Total Weight Adj]) / ([RS % of Total Weight Adj] - LOOKUP([RS % of Total Weight Adj],-1))
              * (MIN([Value]) - LOOKUP(MIN([Value]),-1))
        ELSE
            Null
        END
    END
END
The Weighted Median (padded) calculation returns the weighted median for every mark, the WINDOW_MAX() does that and the PREVIOUS_VALUE() is an optimization:
PREVIOUS_VALUE(WINDOW_MAX([Weighted Median]))
Here’s a view using the American Community Survey data and the Weighted Median (padded) calculation to draw a reference line:

Here’s another view where a simple text table is using the original Weighted Median calculation and there’s a duplicate of the pill on Filters filtering for Special->Non-null values to only return a single mark, and a weighted average as well to see the difference between the weighted median and weighted average in this data:

Likert Weighted Median
As previously noted the Likert Weighted Median assumes that the values are evenly spaced and that each value has the same size, which we’d assume to be the case with a Likert scale with values of 1,2,3,4,5. Like the weighted median calculation above we need to deal with special cases of one or two values that increase the complexity of the calculation. This calculation returns only one non-Null result that is the weighted median.
//Likert weighted median
//if there's only one mark then show that value as the median
IF SIZE()=1 THEN
    MIN([Value])
//if the running sum of weight exactly matches 1/2 the weight then we've found the median
ELSEIF [RS Weight] = [Total Weight]/2 THEN
    MIN([Value])
ELSEIF [RS Weight] > [Total Weight]/2 THEN
    //ignore all marks until we get to a mark that has more than 1/2 the weight
    //first mark has more than 1/2 of weight
    IF FIRST()=0 THEN
        MIN([Value])
        + (LOOKUP(MIN([Value]),1) - MIN([Value])) / 2
        + ([Total Weight]/2 - SUM([Weight])) / SUM([Weight])
          * (LOOKUP(MIN([Value]),1) - MIN([Value]))
    //we're somewhere in the middle (which could be the last mark)
    ELSEIF LOOKUP([RS Weight],-1) < [Total Weight]/2 THEN
            LOOKUP(MIN([Value]),-1)
            + (MIN([Value]) - LOOKUP(MIN([Value]),-1)) / 2
            + ([Total Weight]/2 - LOOKUP([RS Weight],-1)) / SUM([Weight])
              * (MIN([Value])-LOOKUP(MIN([Value]),-1))
    //ignore everything else
    ELSE
        Null
    END
//here in case of an oops
ELSE
    Null
END
Likert Weighted Median (padded)
This calculation uses a similar formula to the Weighted Median (padded) calculation:
PREVIOUS_VALUE(WINDOW_MAX([Likert Weighted Median]))
Here’s a view using Steven Wexler’s Diverging stacked bar technique for likert scales where the weighted median is displayed in the circle:

How to Use the Weighted Median Calculations
Here’s a one-row weighted median.tdsx Tableau Packaged data source that has all of the weighted median calculations:

Here's how to use the file:
- Download the weighted median.tdsx packaged data source file.
- Open the Tableau workbook where you want to generate a weighted median.
- Connect to the weighted median.tdsx file you downloaded.
- If you don’t have Value and Weight fields already in your data source, copy over the Value and Weight calculated fields from the weighted median source 1. Value and Weight Fields to your data source and edit the calculations to point to your particular value and weight fields.
- If the data is not clean (i.e. you have Null values or weights) then from the Dimensions Window in the weighted median source copy all the fields in the 2. Weighted Median Fields folder to your source.
- If necessary add the Exclude for Weighted Median field to the view, filtering for True.
- From the Measures window in the weighted medians source copy all of the fields in the 2. Weighted Median Fields folder to your source.
- Add Value to your view as a continuous dimension and turn off Include in Tooltips for the Value dimension (since it is only present to calculate the weighted median).
- Add other views as necessary.
- Add one of the Weighted Median or Likert Weighted Median calcs to the view and set the Compute Using to the Value dimension (and potentially other dimensions depending on how you want the calculation to be partitioned).
- Set the default value of the Choose interpolation parameter to the desired value, the default is a weighted interpolation.
- Set up the rest of the view as desired.
Here’s a video of using the above steps on fruit and vegetable consumption data from the 2015 Behavioral Risk Factor Surveillance System survey by the US Centers for Disease Control:
Conclusion
Even when we don’t have the ease of use of a built-in function for something like a weighted median it’s possible to build out rather complicated logic in Tableau and then share it. Here are links to files used in this post:
- Tableau Public workbook Weighted Median
- Tableau packaged data source weighted median.tdsx
- Video tutorial on Vimeo Weighted Medians for Weighted Data in Tableau
If you find this useful, let us know in the comments below! And check out our services offerings, we can help you translate most any calculation or design you can imagine into your own Tableau views.
