Building SVG Paths in Alteryx + Tableau
/Background
Recently my family watched Disney’s Moana for the first time. We all really enjoyed the movie, especially my two young daughters. After the movie was over, my five-year-old noticed the spiral in the title on the movie case and asked me whether I could build it on the computer. I figured this was as good an opportunity as any to show her the power and possibilities of math.
Thus, I started thinking through all the different ways this could be done. If nothing else, I thought it would be a fun enough challenge to try.
Use case … not so much
There is not much of a use case here, basically, I am taking SVG path coordinates and translating them into points for Tableau to render. Having said, that, showing my daughter that this can be built with math and the challenge it posed was enough for me. I doubt you will be using this technique in your day job (but let me know if you do!).
Attempt 1 (Math Only):
I started by researching spirals and all the different types (there are a lot and it is kind of awesome). I found the wiki page for Fermat’s spiral and via the eye ball test concluded that it appeared to be the base spiral leveraged to build what I was looking for. Using polar coordinates, creating the spiral is only a few simple equations coupled with data densification:
Here is the data source I loaded into Tableau:

Here are the functions built (also available in the embedded workbook below):

The above lead me to this result (note that I only took the blue spiral to 315 degrees when bringing the data into Tableau):

Not bad, definitely looks like the right spiral, but it doesn’t have the outline that will make the spiral result recognizable to my daughter.
Attempt 2
PNG -> SVG -> Alteryx Parsing -> Tableau Densification & Render
I wanted to get more exact on the re-build, to do this I need information of the image. What were the various coordinates being used to draw the out line of the shape? Ultimately, I found this image and leveraged pngtosvg.com to convert it into SVG. In addition, I also found this Alteryx workflow by Niccolo Cirone and I was on my way with a new approach.
I did a little manual work to identify the specific SVG path I wanted and removed all the extra stuff I didn’t need. This made it easier to debug as I went. I put this data in the above workflow and crossed my fingers…
I quickly realized that I needed to augment the workflow to account for the curves and lines that I needed to draw. My image is not detailed enough to just plot the raw coordinate points of the SVG which the workflow seemed to provide.

I already have built curves in Tableau, so the thought was to do some data prep and copy the math from my other workbook. Here is the Alteryx workflow to prepare the data for densification and math in Tableau.

Here is the data output from the above flow:

I brought the above into Tableau, parsed the coordinates of the SVG paths and calculated the lines and/or Bezier curves (C = Cubic Bezier Curve, L = Line, M = Move To) within Tableau. Here is my result (see embedded workbook for detailed calculations):
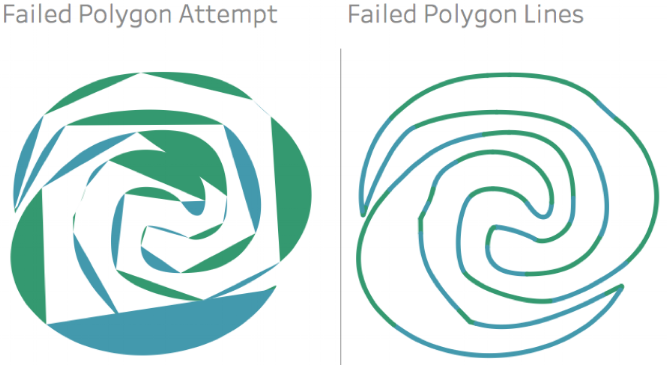
I have the shape outline and my line version looks pretty good. But the problem with the polygon view is the “svg_path_id” pill.

With the densification I am doing, I am calculating each line and curve as a stand alone item and because of that I am required to have this pill on the detail shelf, which renders my 1 SVG as 34 separate polygons, and thus they do not quite fit the mold of the single SVG I am going for when viewing as polygon mark type.
I may be able to figure this out in Tableau, but also thought it would be fun to try and calculate the Bezier curves in Alteryx. So I went that route (if you have a fix for my problem above within Tableau, let me know, I will add it here).
Attempt 3
PNG -> SVG -> Alteryx Parsing, Densification & Calculations -> Tableau Render:
Using the below addition to the above workflow, I pushed all the calculations into Alteryx and created a single SVG level output for Tableau.

The nice thing here is I no longer had to do data densification in Tableau, the downside is that the Alteryx workflow is more complicated. This is ultimately a give and take really as I need to do the math somewhere.
I brought this dataset into Tableau, and dragged the following pills:
- svg_id on detail
- svg_record_id on path
- BezierX on Columns
- BezierY on Rows
And… viola!
Limitations
The Alteryx workflow will only handle single SVGs with M, C and/or L SVG Path elements. This can of course be expanded to other SVG elements like Q and A if the need arises.
